
Visualizing Network Fabric Topologies at Scale
Cisco Data Center Network Manager (DCNM)
The brief
Provide a network administrator with an overview of the network while highlighting problems with the inter-switch links.
Displaying inter-switch connection status in a densely connected, 1,000+ node fabric. This was part of a larger feature-set focused on automated configuration and provisioning for large networks in the data center. Key aspects of this project: ease-of-use and scalability.
The challenge
Traditional network topology displays are not designed to handle link status information in a highly dense network. A fabric architecture where each spine node is connected to every leaf node, scaling up to a thousand nodes, can have over 64,000 links. The challenge we faced: how to give the network administrator an overview of the network while providing clear information regarding link status within the fabric?
What I did
This project began with many white board discussions and sketches, followed by mockup iterations and meetings with stakeholders. Finally, I created a prototype to test feasibility and interactions.
Key tools and methods
Sketching solutions
Scale prototype using Processing
Omnigraffle mockups
Interaction design
Adobe Flex
Outcome
This visualization became a showcase feature on a billion dollar product line and was awarded a patent.
My approach
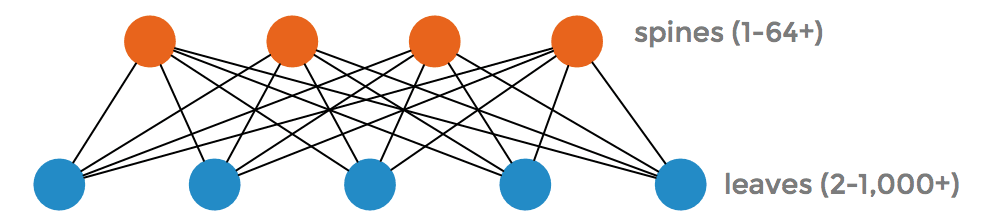
The fabric's structure is a bipartite graph, split into spines and leaves where every spine is connected to every leaf. It was clear that there would be no way to display all of the connections as this reached the expected scale.
Structure and Scale
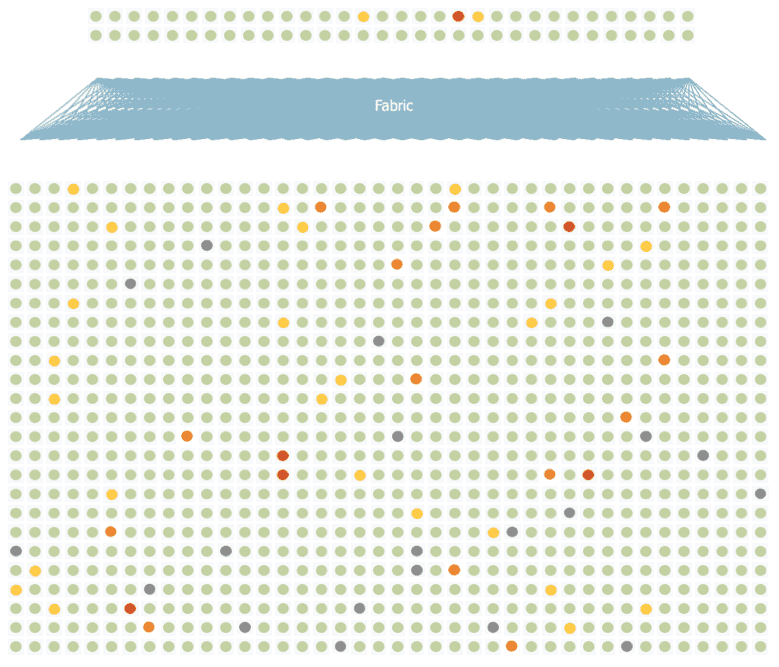
To address the scale, I decided to remove link entirely, focusing on nodes to indicate any link issues. I tested colors at scale by scripting the visualization in Processing, ultimately choosing pale green to represent the all ok state so that it could fade into the background, letting alarm states attract attention.
Mockups
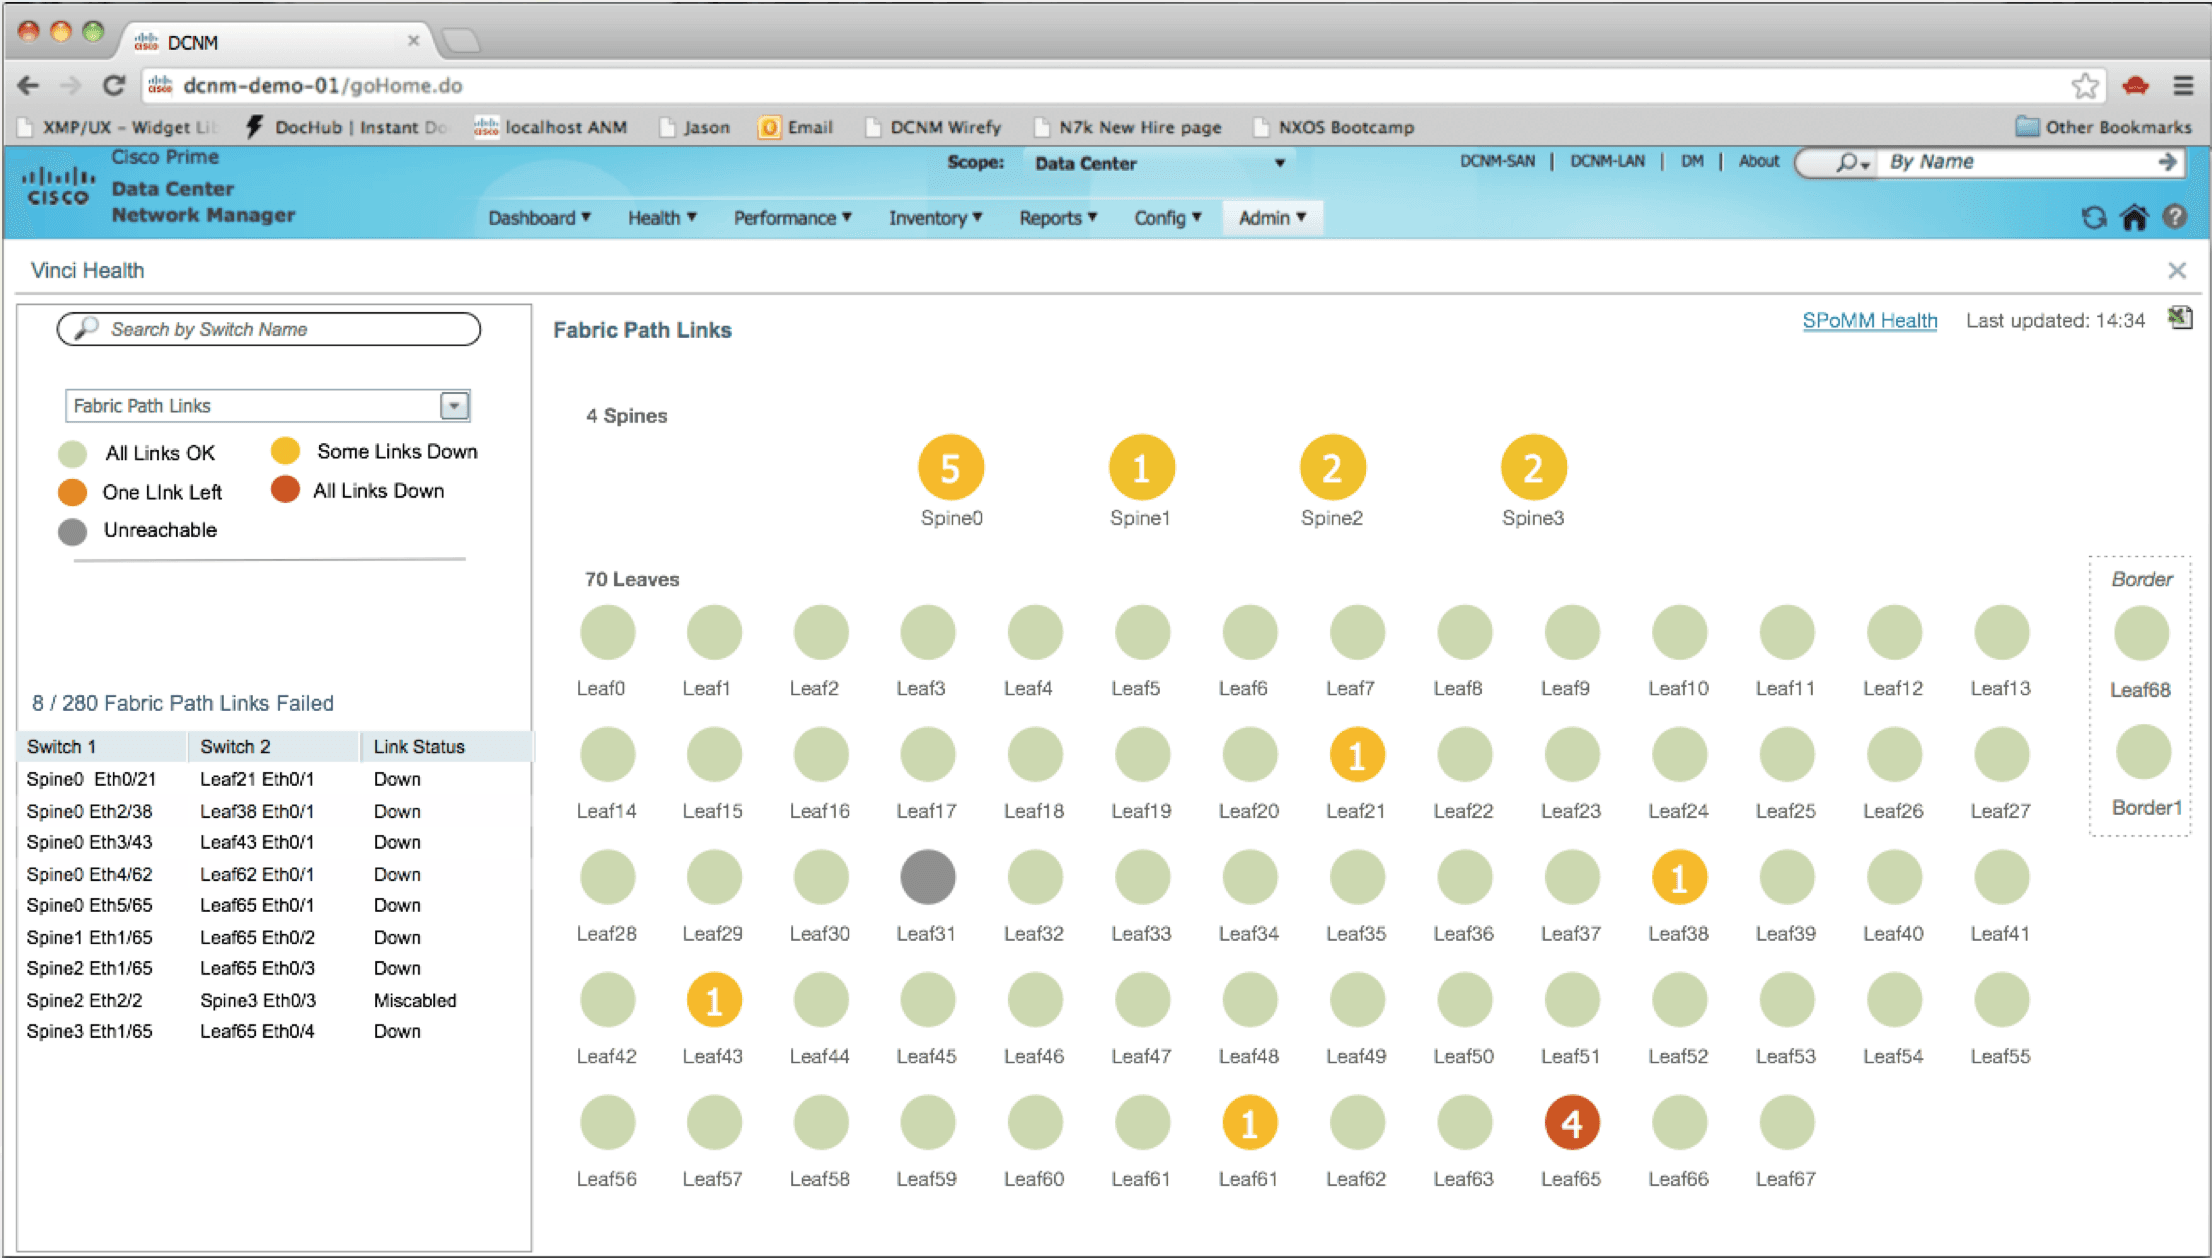
Mockups were key in aiding team discussions. This phase added an important aspect to the design: numbers that indicate the scale of the problem. When a switch has some down links, not only does it impact the color of the node, but a number is drawn on top. This only occurs when scale and the size of the nodes permit.
Interaction Design
Users select a spine or leaf, then can hover over any other node to view link details between the two nodes.
I tried many alternatives before settling on this solution, which I found to provide the most clear access to information while avoiding obscuring the underlying data.
Lessons
We learned that two-tier topologies are not physically practical at high scale. The cable bundle size and space requirements impose physical restrictions. The December 2014 release of DCNM supports a three-tier fabric topology.

Other Case Studies

Actionable Cloud Cost Recommendations
A rapid product redesign that ensured customers could actually reduce public cloud costs.
Read Case Study

Self-Service Onboarding
(PLG)
Lessons in product-led growth and increasing the number of successful activations.
Read Case Study
Interested in learning more?
Contact me at kora@korabongen.com